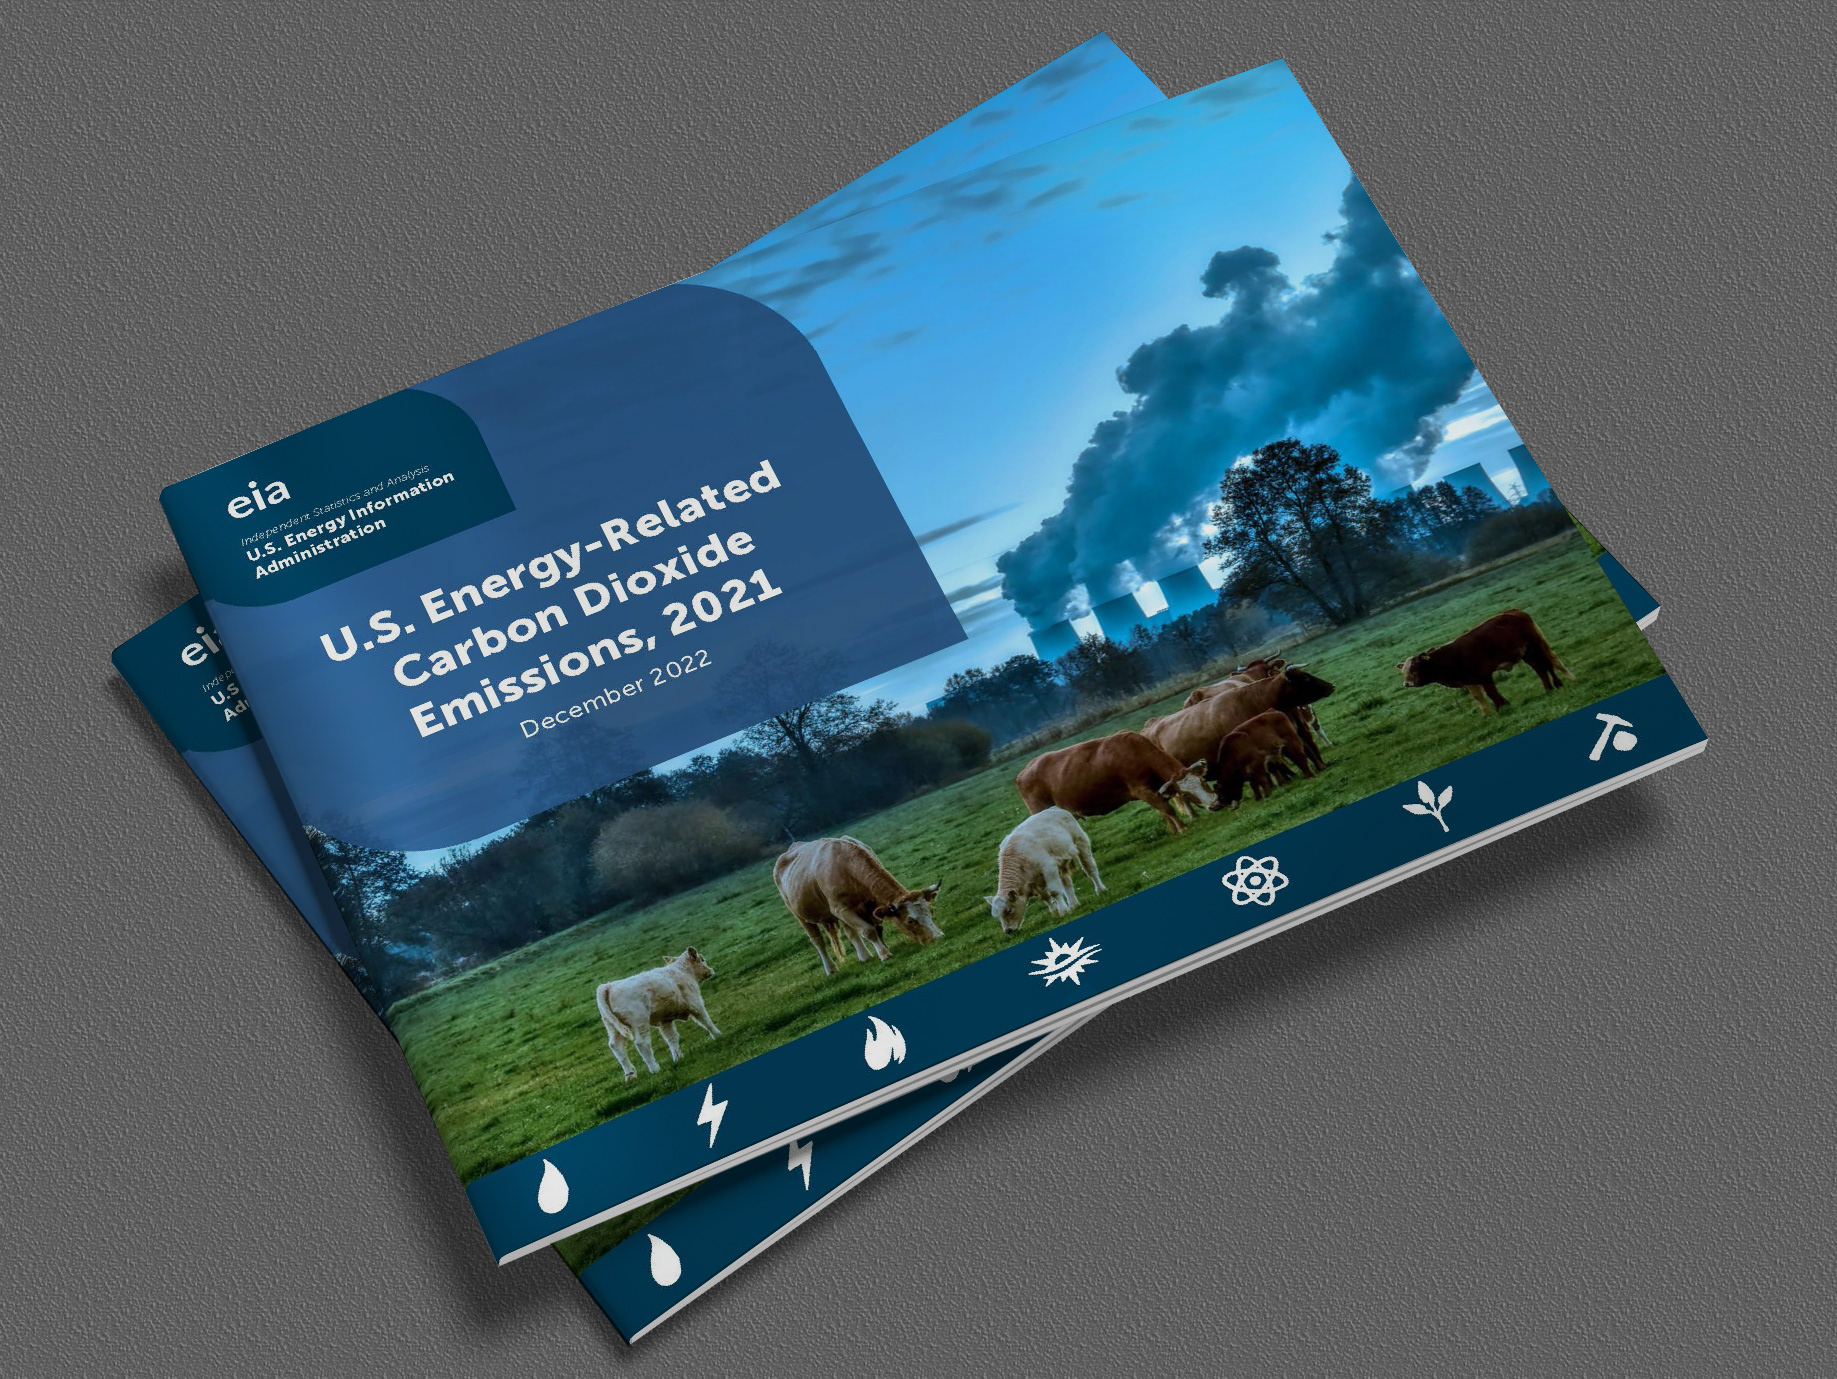
I self-initiated redesigning this report from the U.S. Energy Information Administration (EIA) to increase reader engagement by using attractive visuals and call-outs for key information. I also remediated the report for accessibility to meet WCAG 2.1 AAA standards (the highest level of compliance) for PDFs.
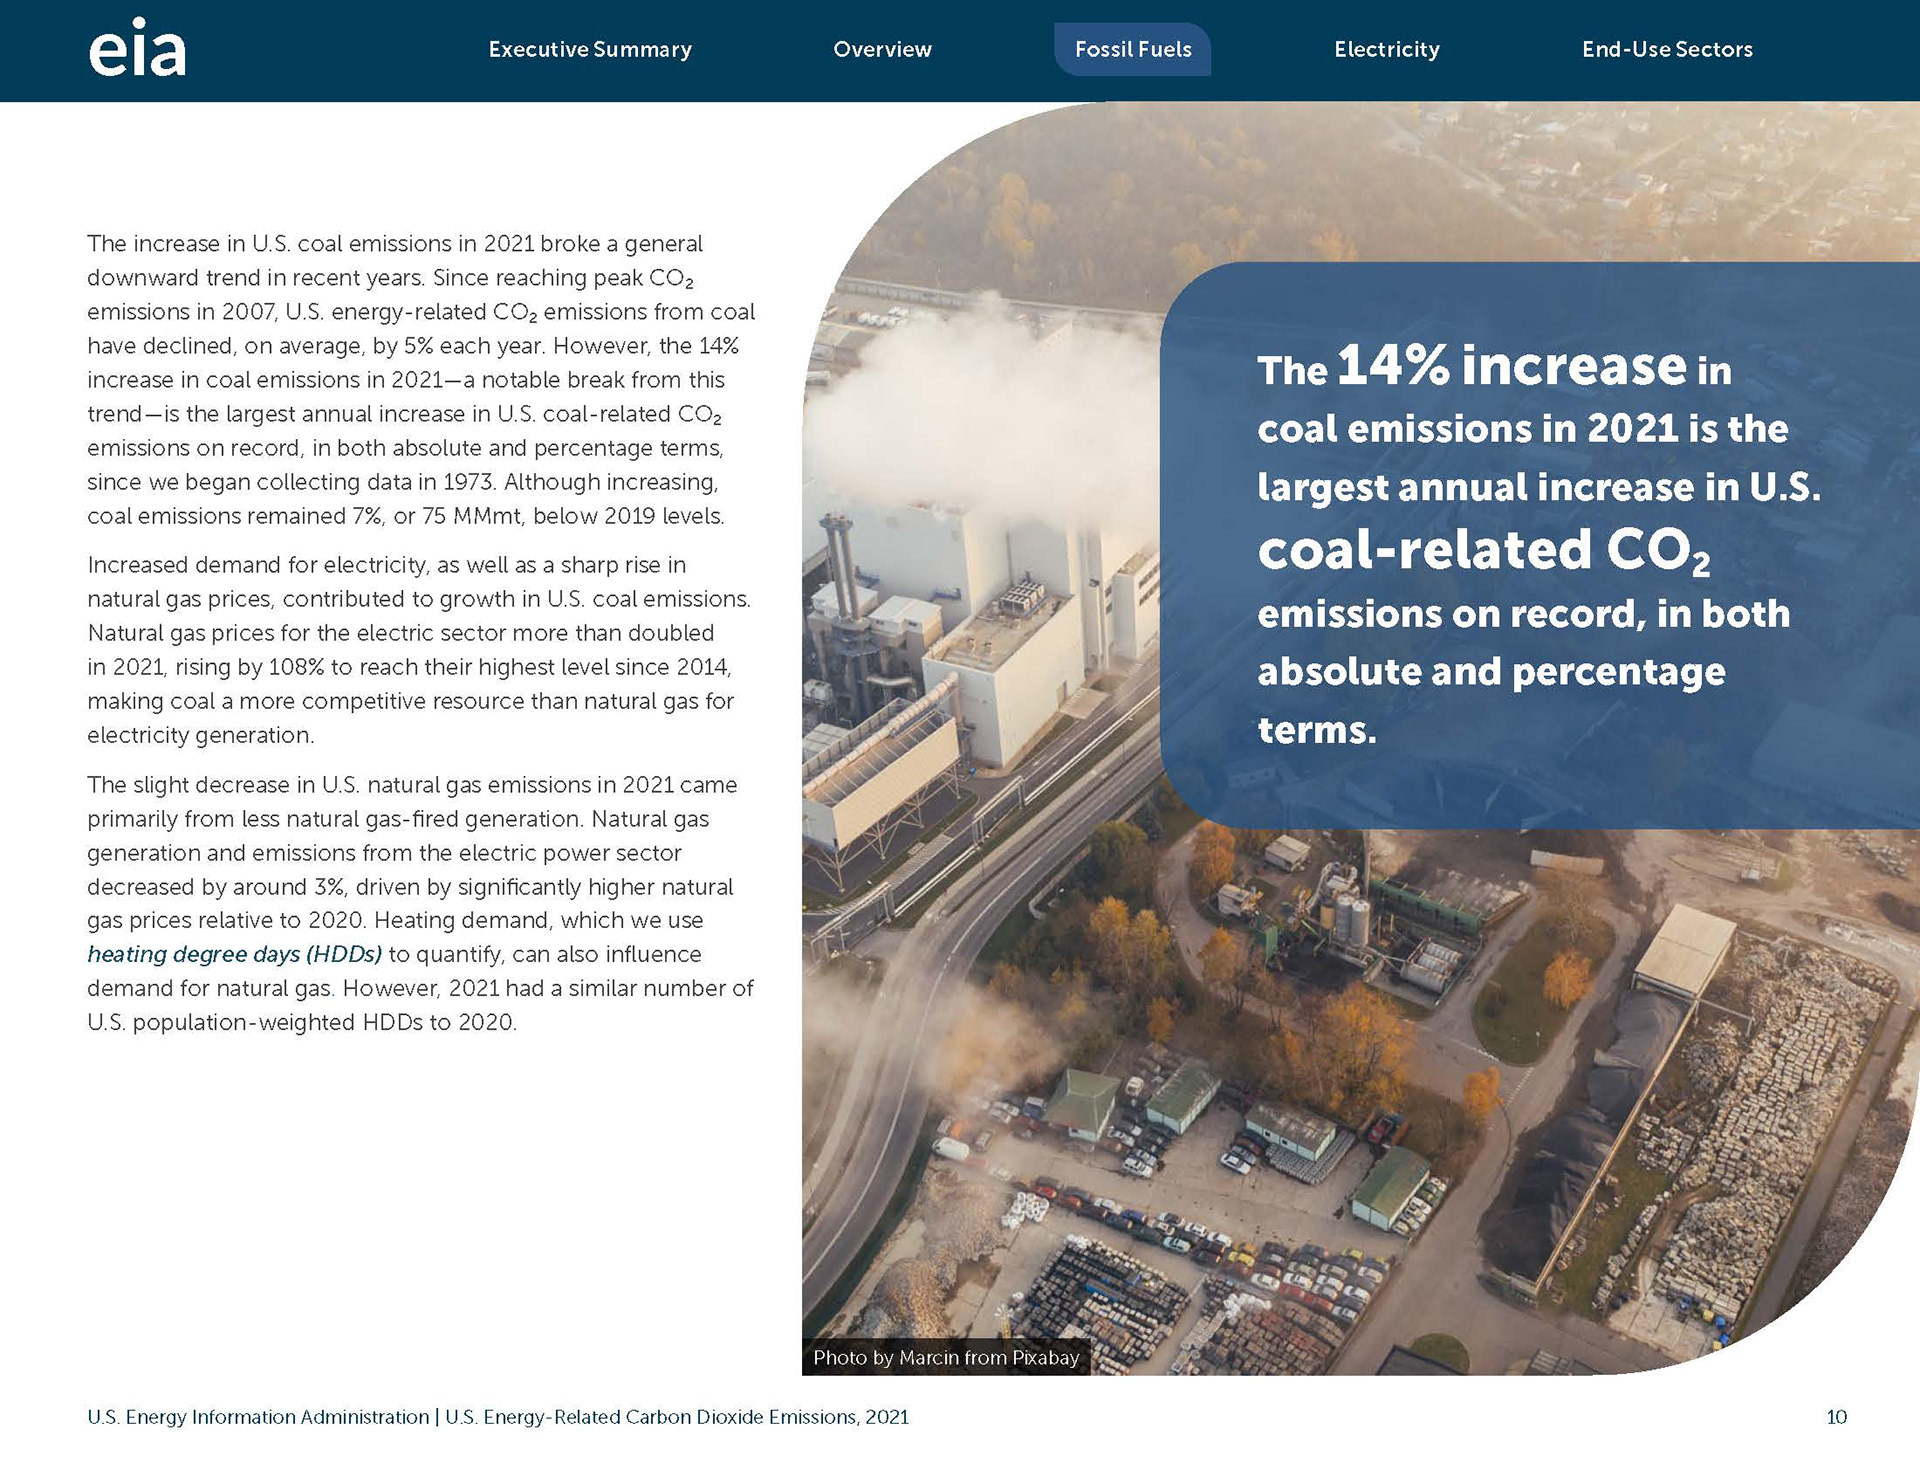
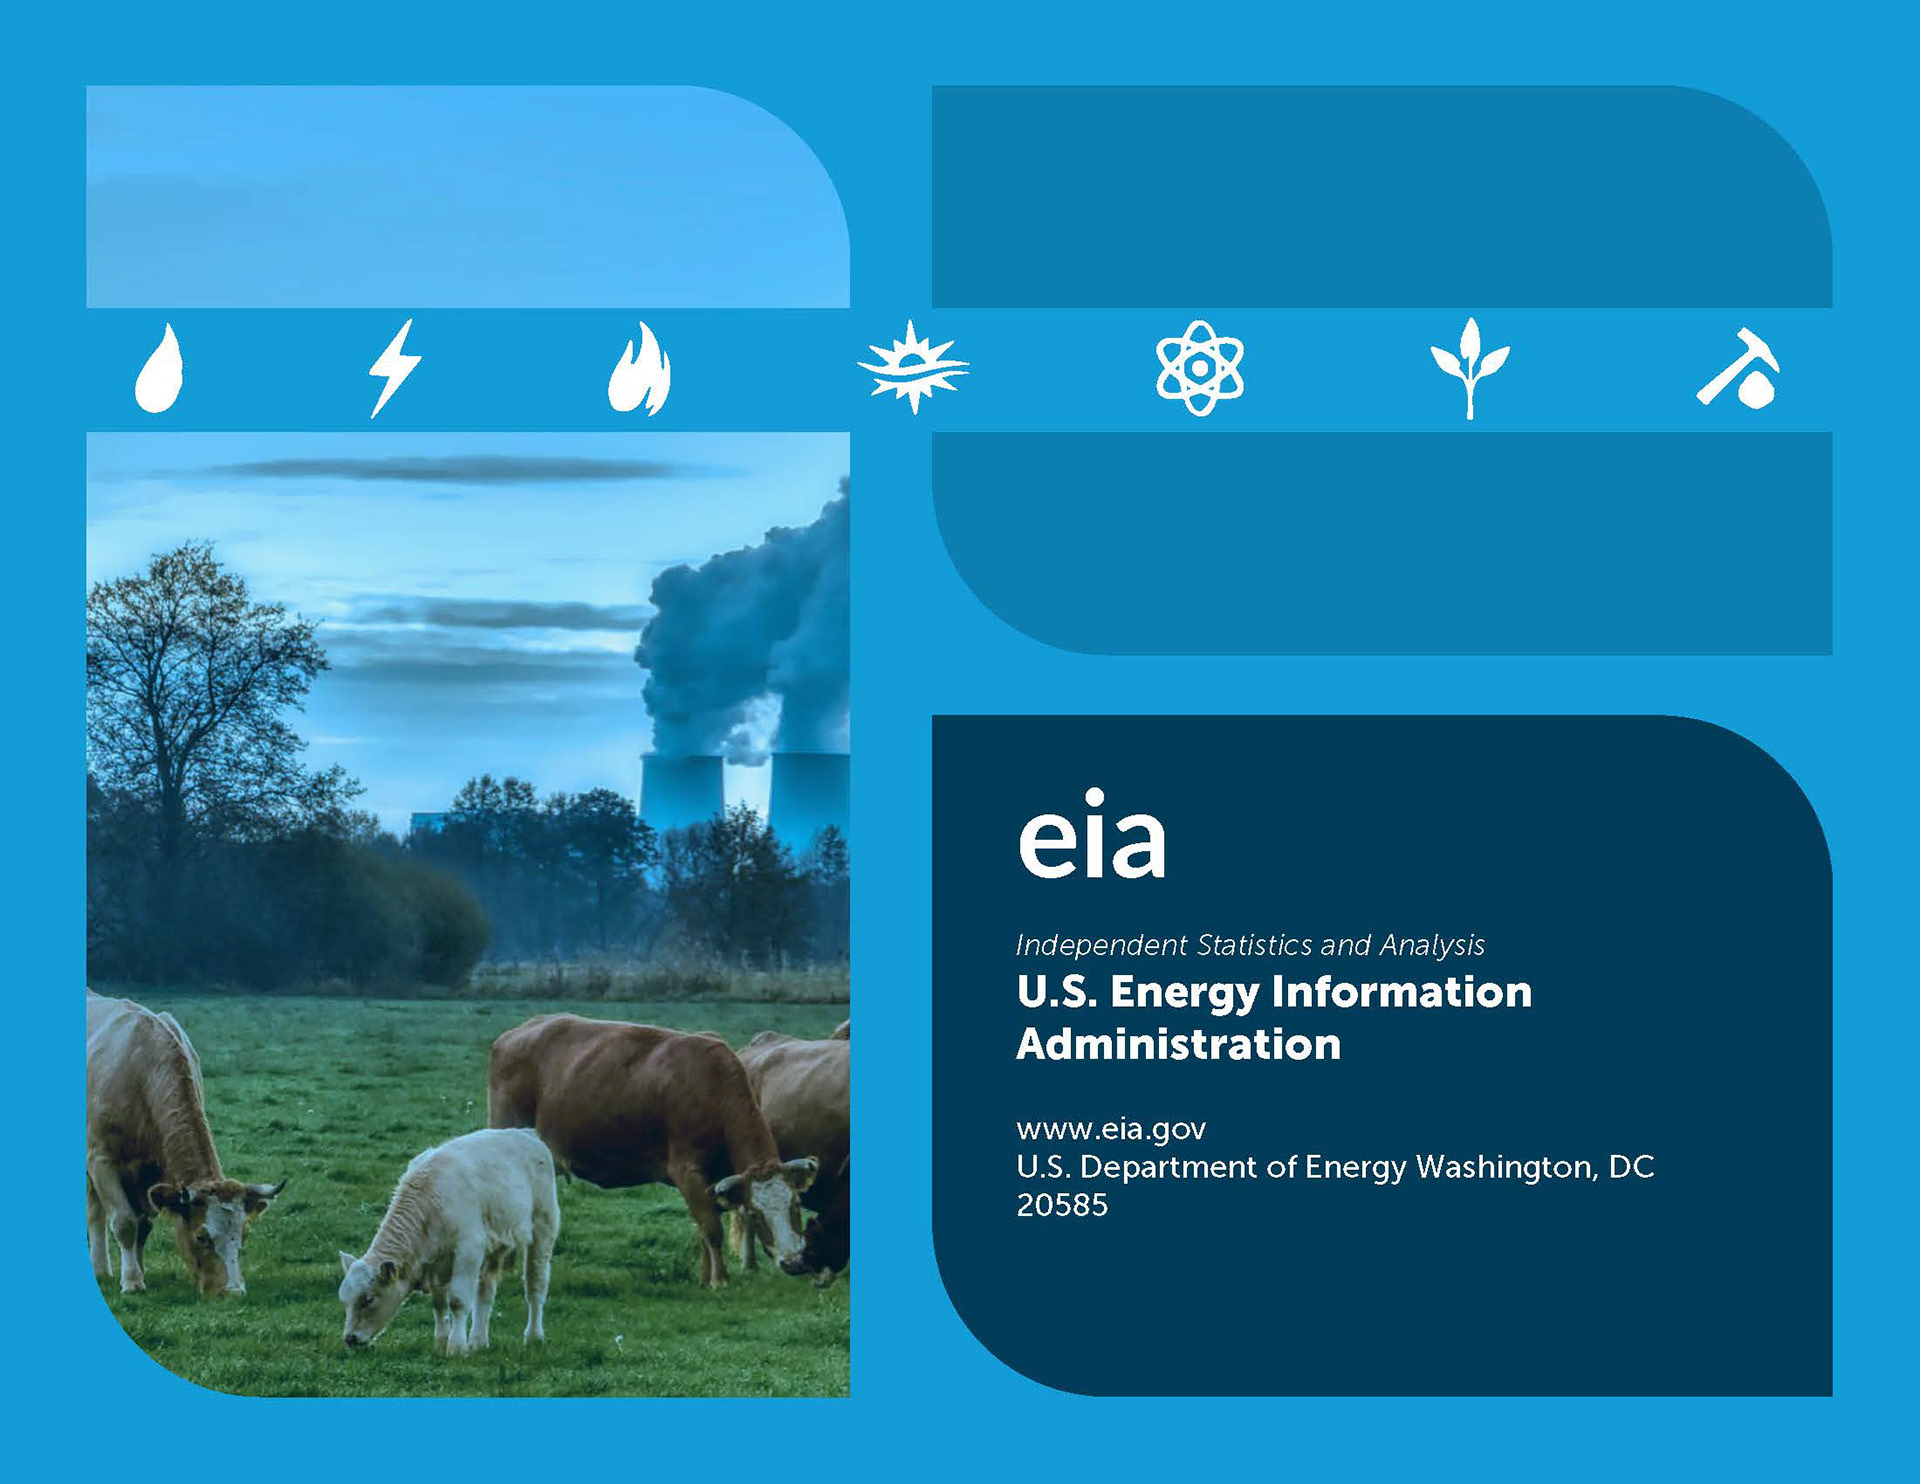
The photos selected for this report were found from free stock image sources. Rather than choosing photos focusing on pollution and massive carbon dioxide emissions, I chose photos with a more positive or neutral focus—for example, electricity being used to light up a city at night; vehicles on a busy intersection; and wind and solar power plants. My goal was to avoid photos that might elicit strong emotional responses from the readers, as this would detract from a focus on the information in the report.
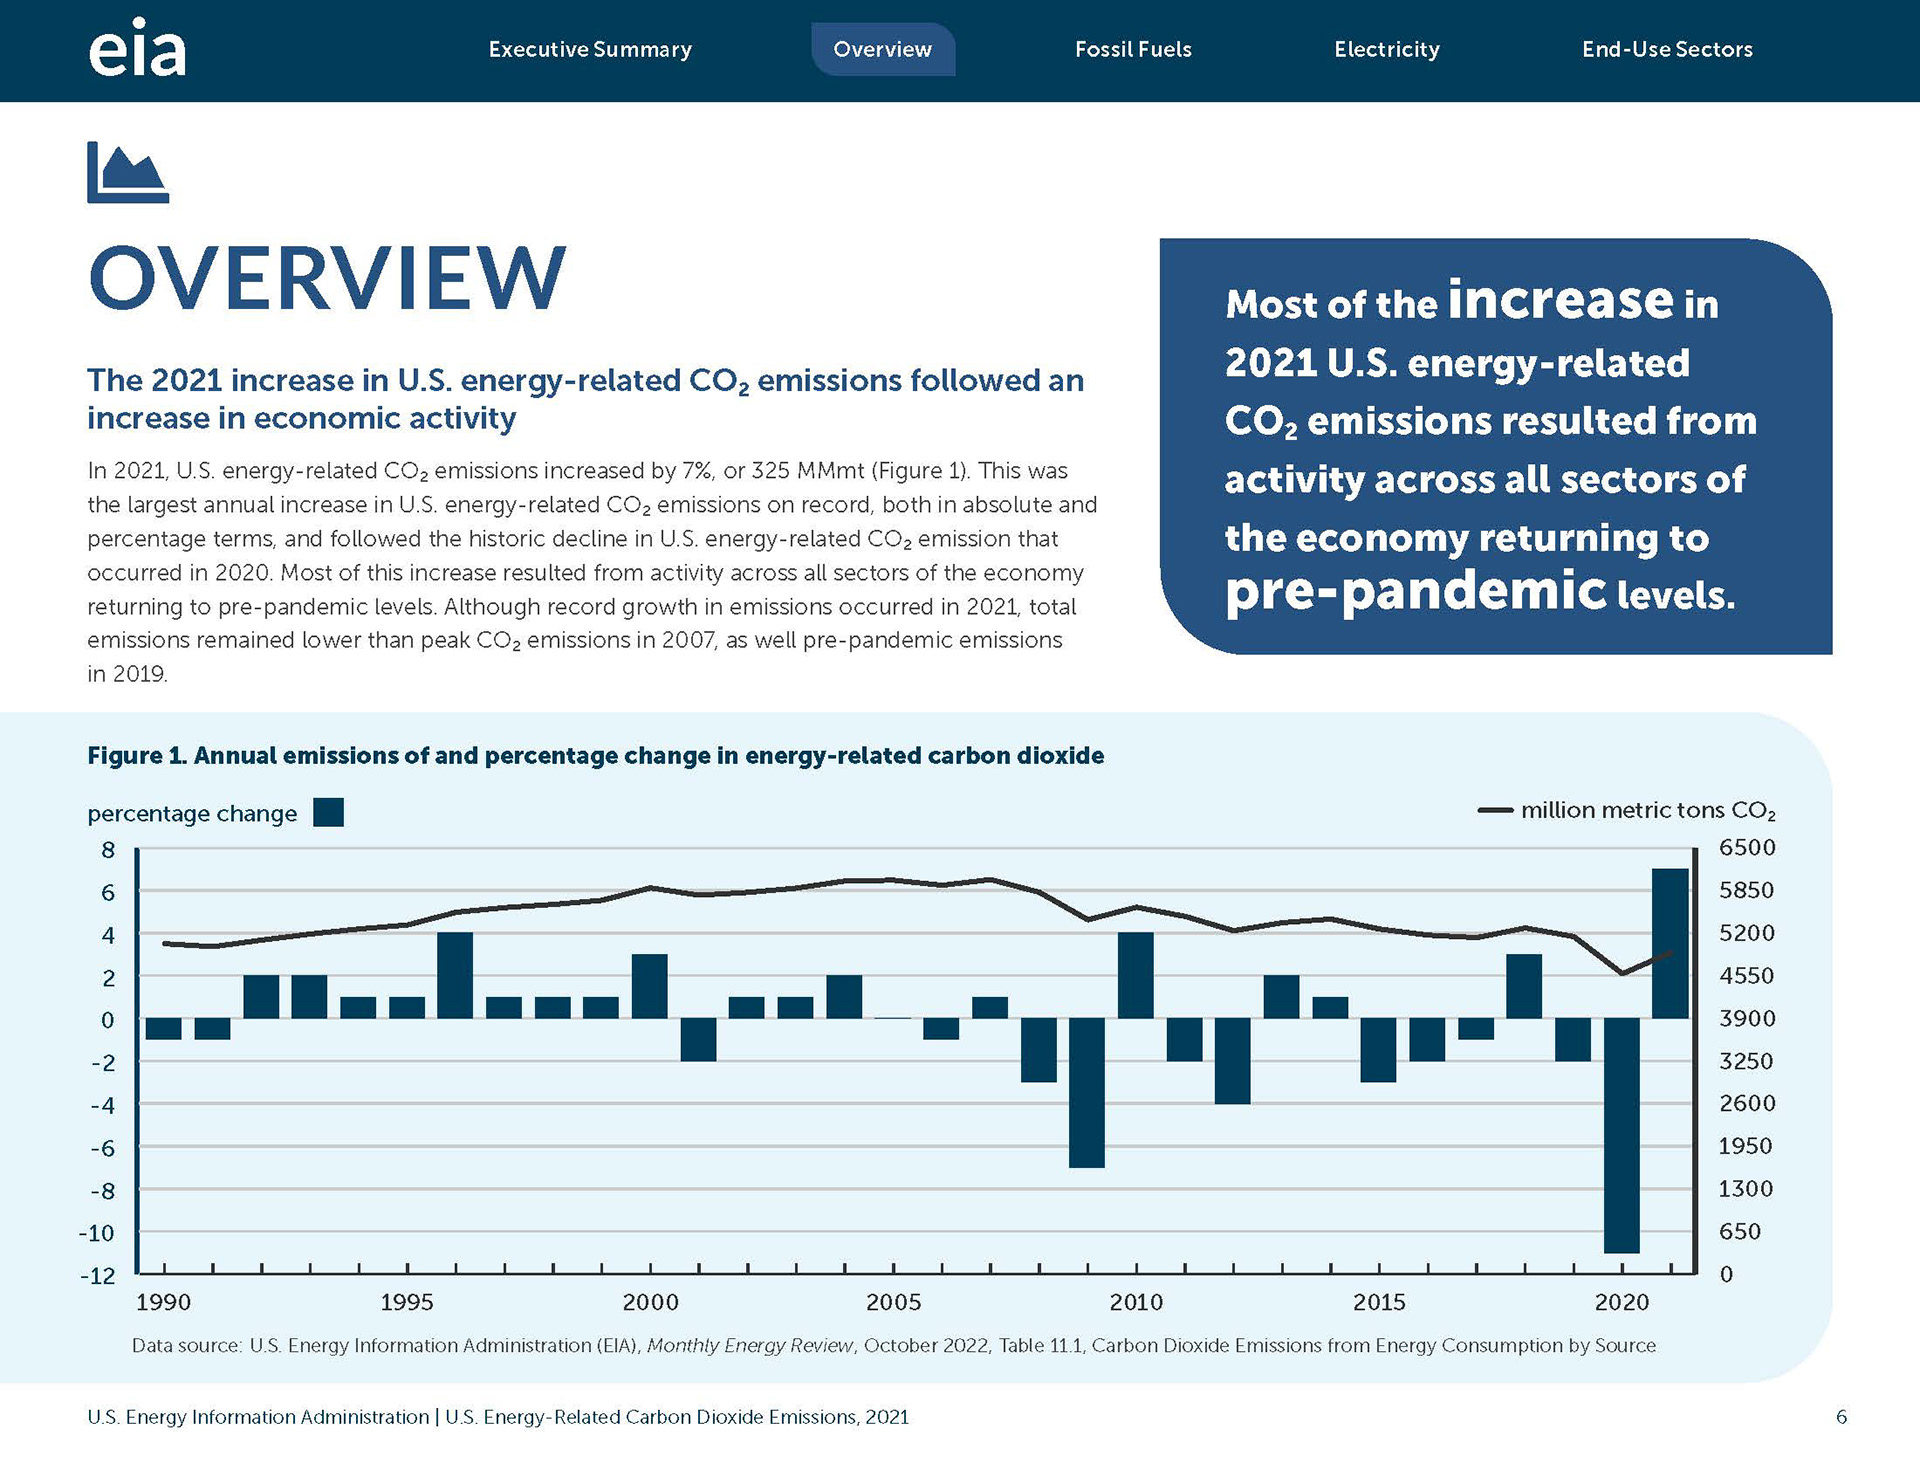
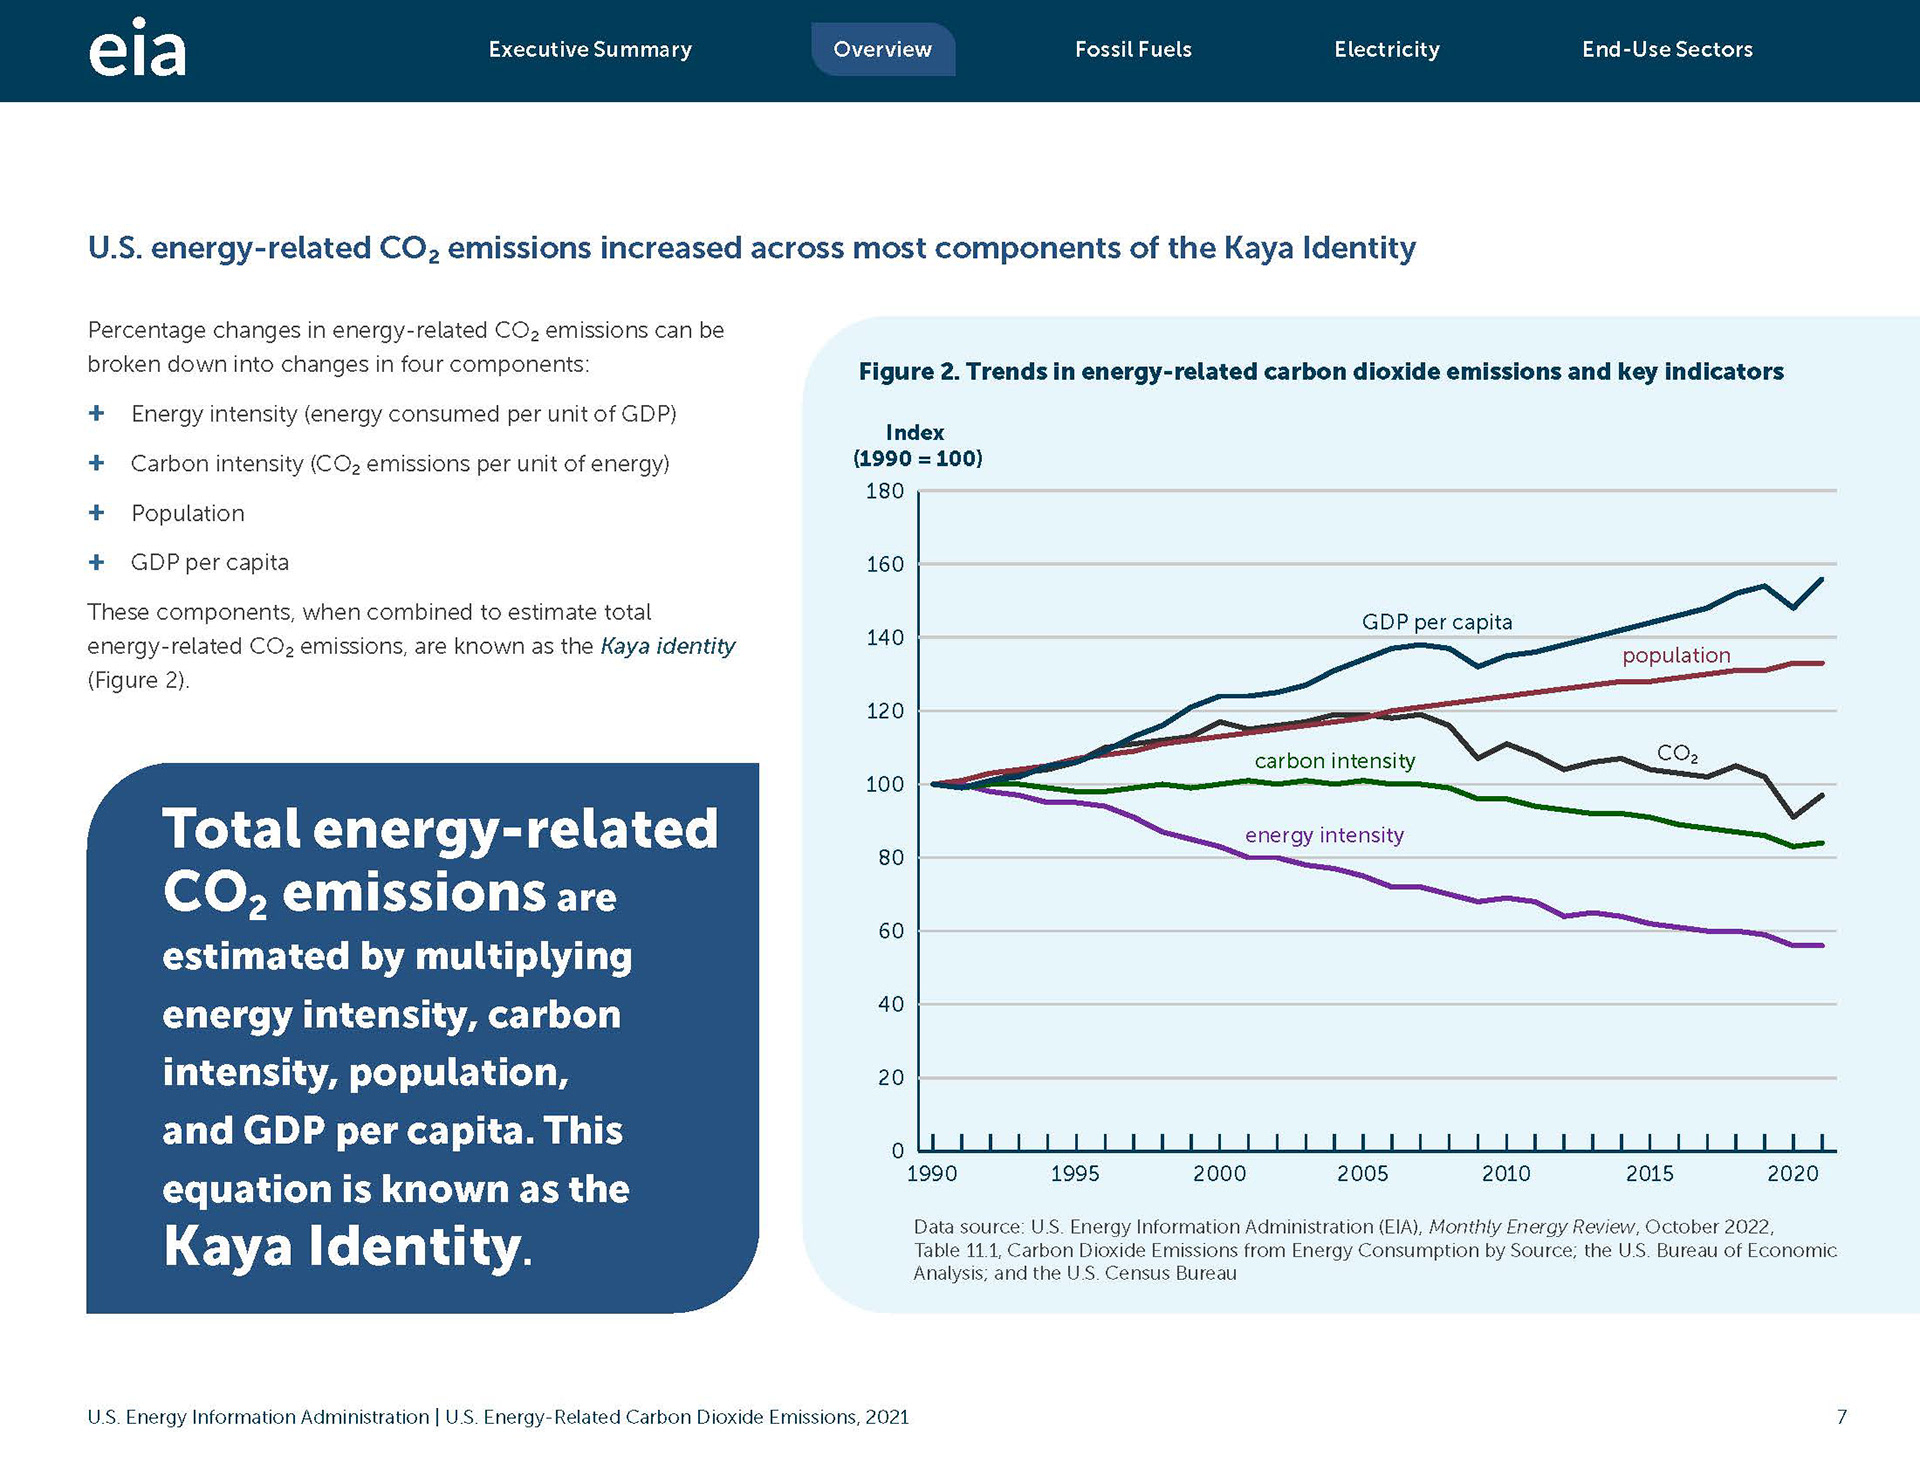
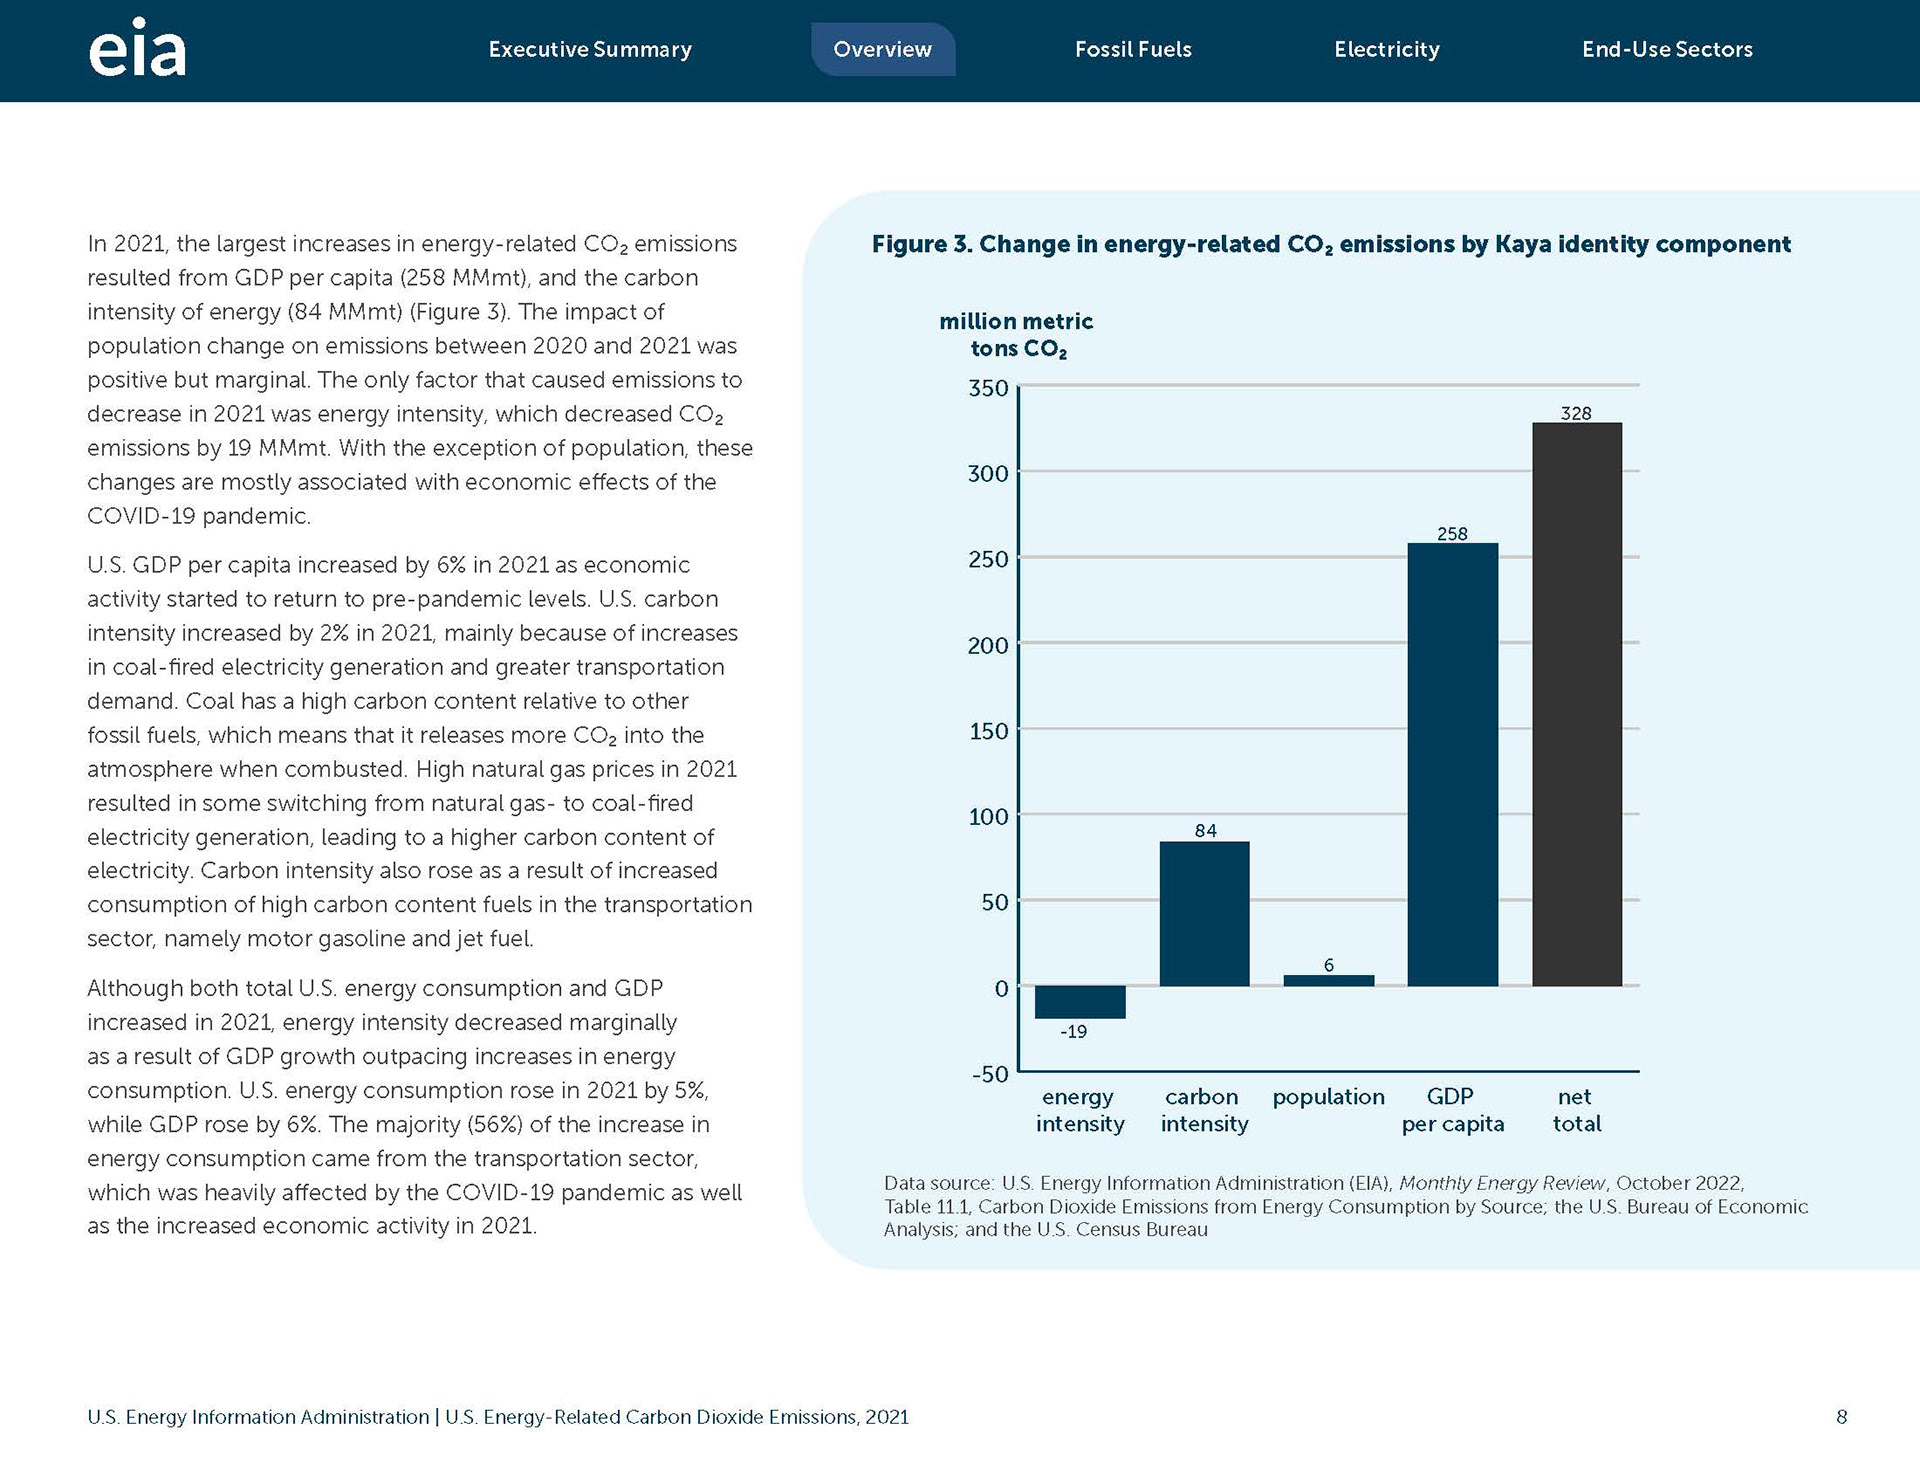
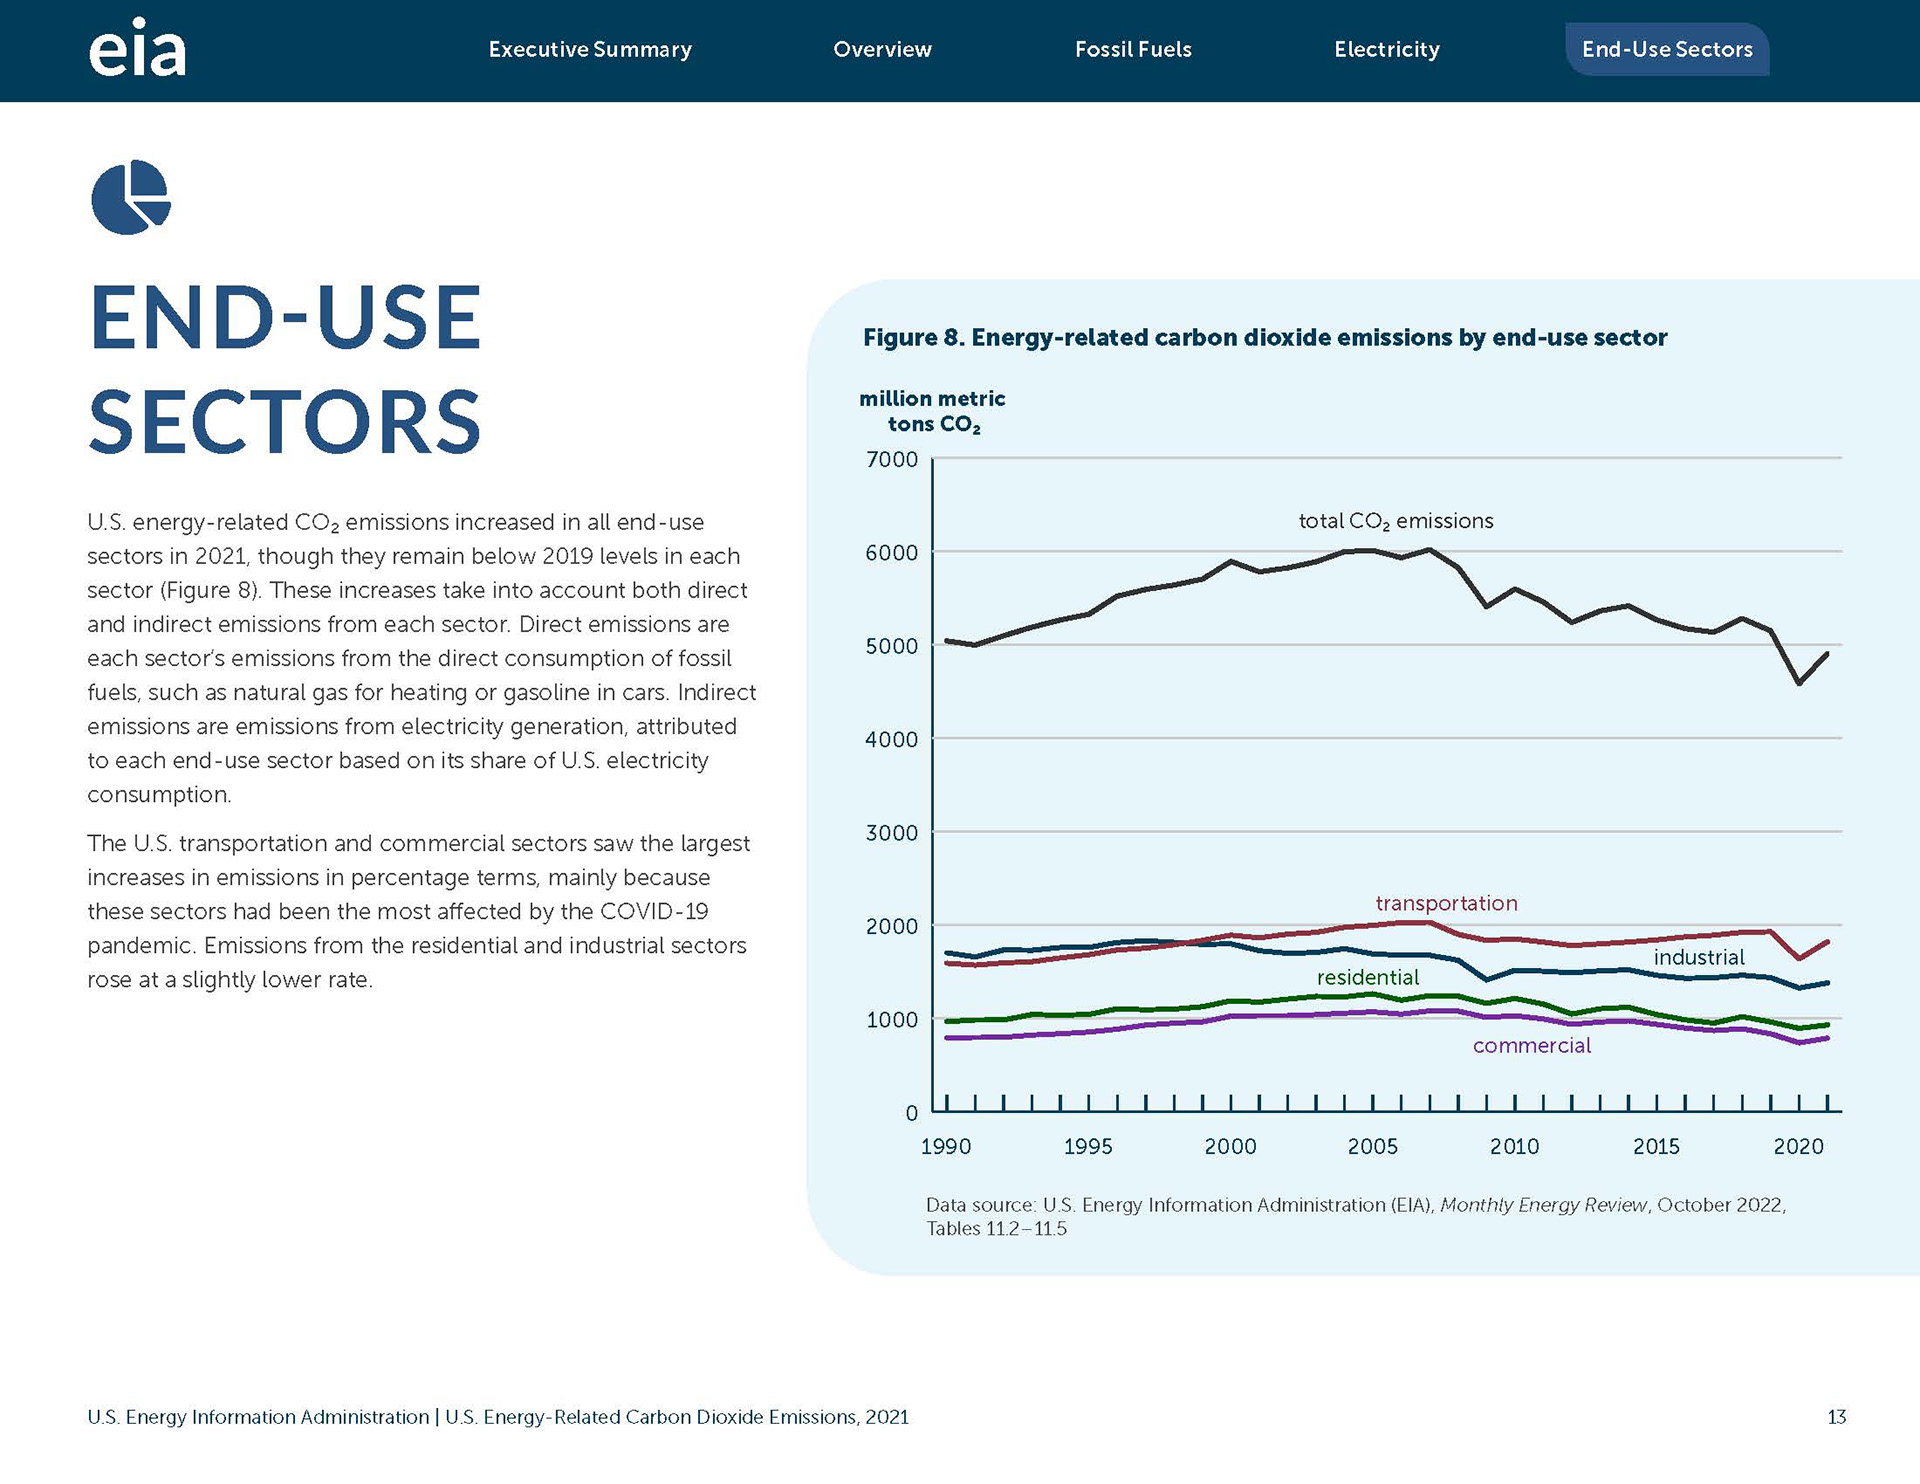
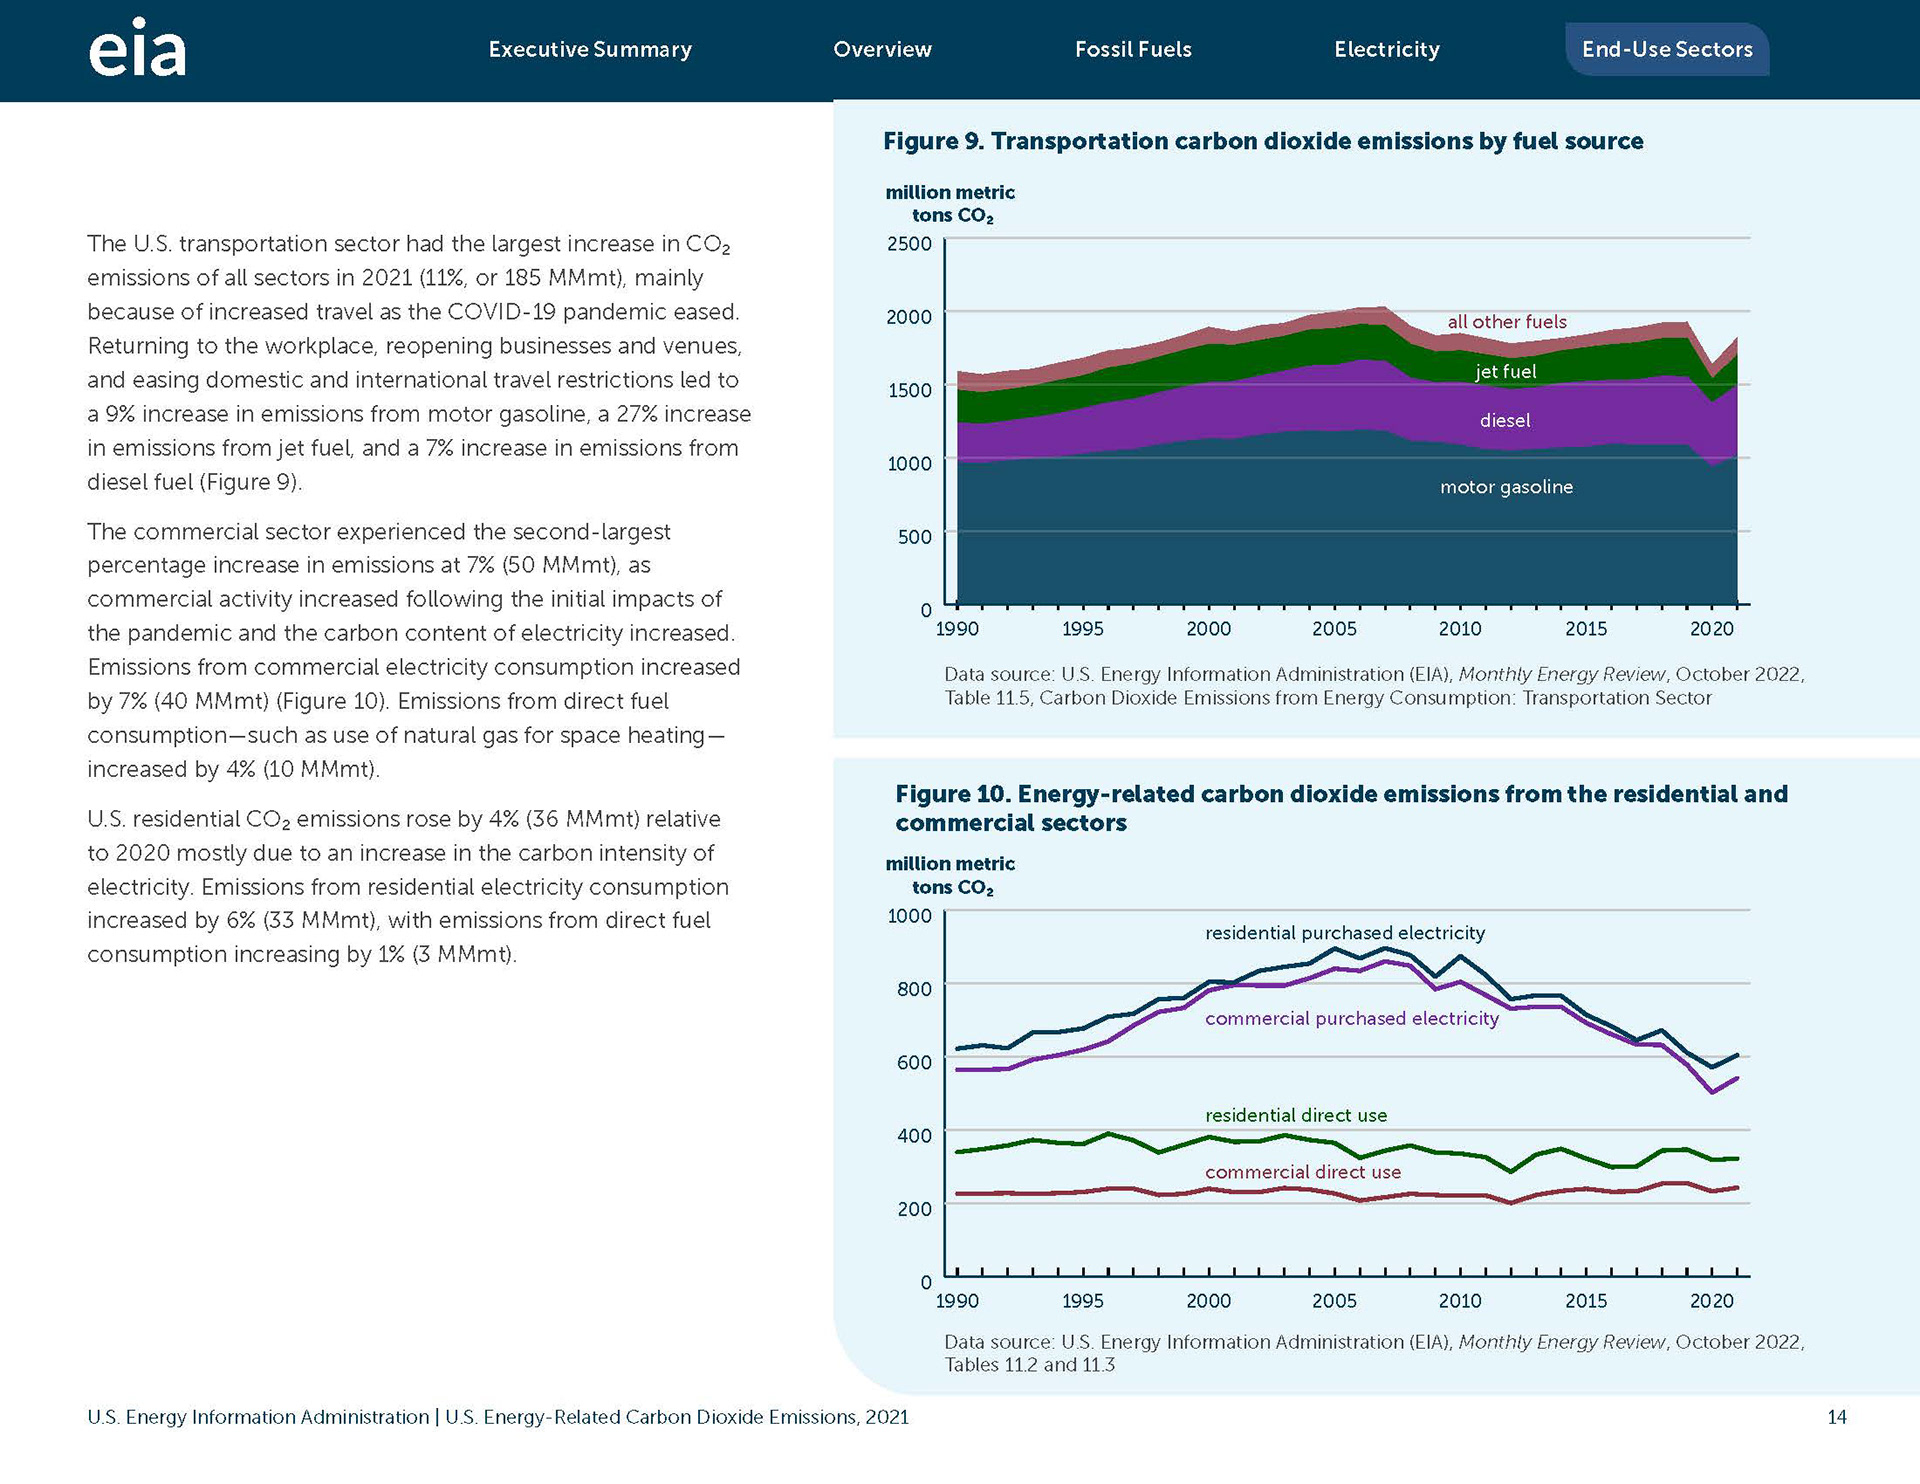
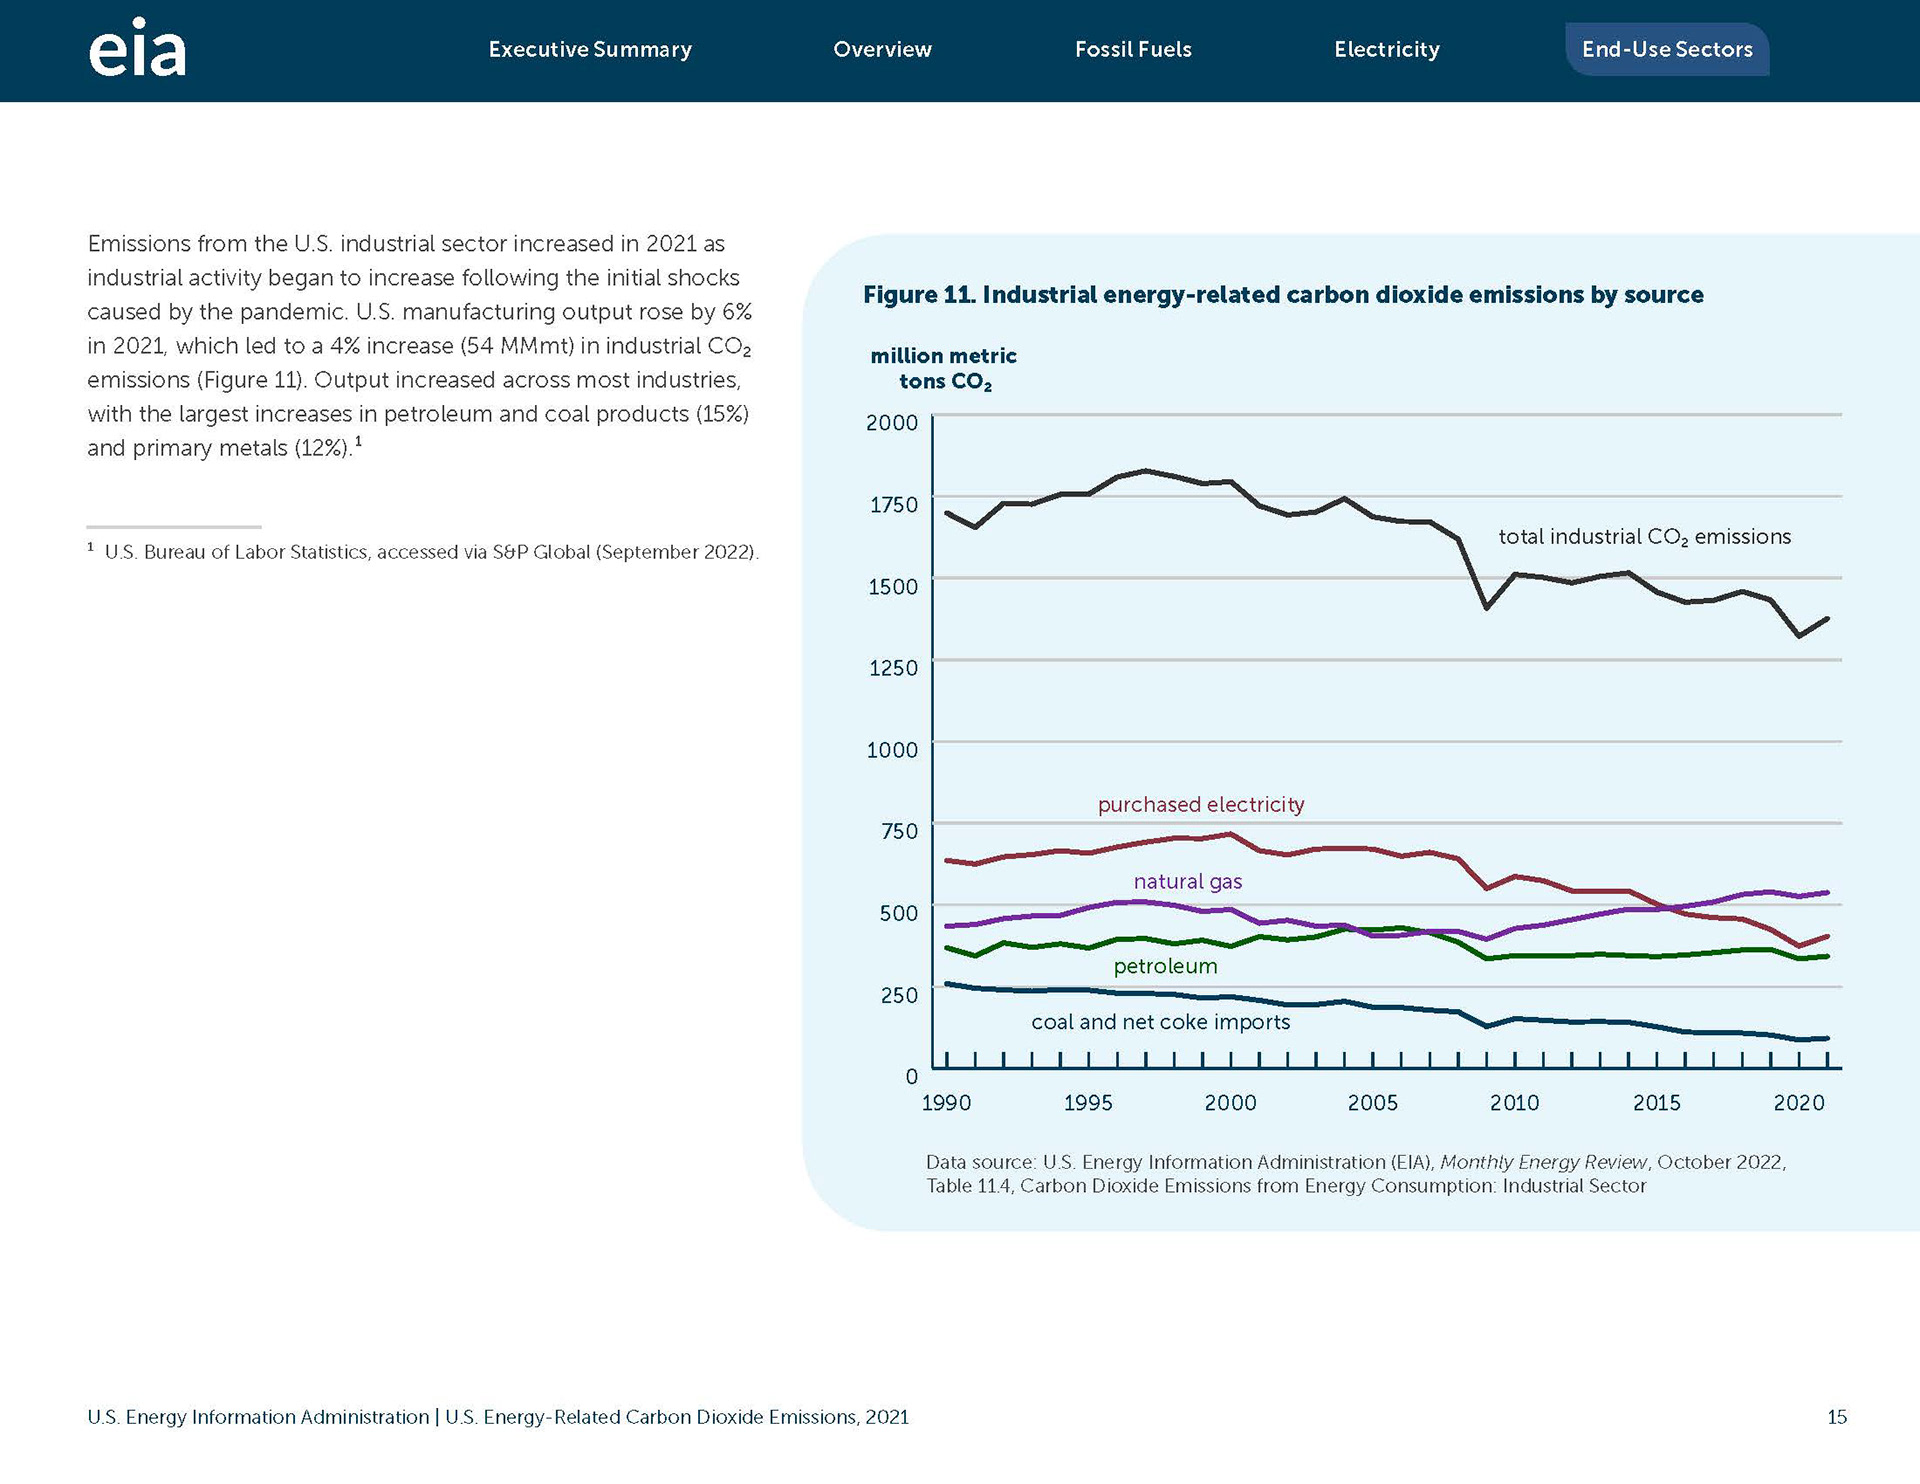
A major portion of this project was recreating the eleven graphs to give them a uniform style and color scheme. I created each graph in Adobe Illustrator using the original source data from EIA to maintain total accuracy. The updated color scheme is more cohesive, and unlike the original, complies with WCAG 2.1 AAA standards for color contrast.